
+7 (495) 226-85-50


Blog about successful marketing strategies in russia
Understanding the Russian Media Landscape: A Complete Guide


MEDIA BUYING
Share this Post
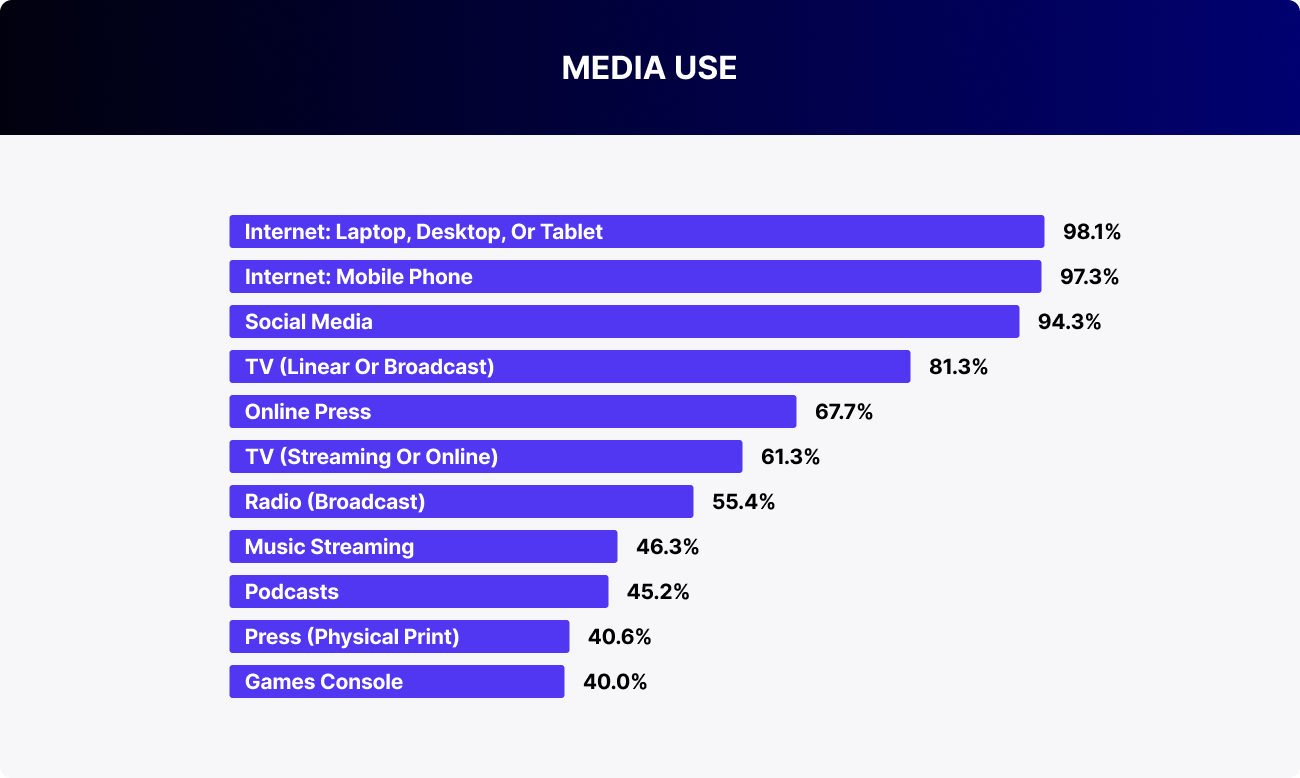
Online media in Russia is read by 67.3% of internet users aged 16 and older. That’s roughly 89.4 million people. Print publications reach about 53.8 million. The press still holds its place as a meaningful source of information, especially among older age groups. However, media consumption habits are shifting: the practice of reading print is fading, while digital consumption continues to grow, both in reach and engagement.
Over the past two years, the circulation of print publications has dropped by 12%, and most editorial offices are shifting their focus to online platforms. Increased website traffic, integration into Telegram and Dzen, and paid subscriptions all help maintain the audience and boost digital revenue.
Against this backdrop, the government continues to provide strong support for the industry. In 2025, 137.2 billion rubles will be allocated from the federal budget for funding Russian media. This is more than the previous year's amount of 121.3 billion rubles and represents the largest funding in recent years. This covers both federal and regional editorial offices, including news agencies, television, and print publications.
This support allows major players to remain in the market despite falling circulation and the transformation of business models. However, starting in 2026, a nearly one-third reduction in budget funding is planned. This creates a new point of pressure, as editorial offices will have to adapt more quickly to the digital model and more actively enter the commercial market.
For brands, this is a signal: collaboration with media will become more flexible, and interest in native advertising and integrations will increase. This is especially true for publications that have already built a digital audience and are ready for partnership formats.
Despite the rapid digitalization, print publications in Russia still maintain a presence in subscription catalogs, especially in niche and regional segments. This primarily includes specialized magazines about health, cooking, and gardening, as well as some glossy publications that have shifted focus to the domestic market.
However, the key audience for brands is increasingly found not at kiosks, but on websites, in Telegram, or on VKontakte. To understand which media to collaborate with, it’s important to look not only at circulation figures but also at the overall reach, including the online audience, as well as citation frequency, which is a key indicator of influence and trust in the publication.
Next, we’ll look at the rankings of leading newspapers and magazines in Russia by reach and citation frequency, with a focus on those publications that maintain real media power and may be of interest for advertising.
Top media outlets’ ratings by coverage and citations
In evaluating newspaper and magazine rankings, we consider two key metrics: coverage and citation. Coverage indicates the number of readers a publication has, which is an important factor in gauging its popularity and the interest of advertisers. The citation rate indicates the frequency with which the publication's materials are referenced by other media outlets. This reflects the publication's authority and importance within the media landscape. These indicators collectively provide a comprehensive understanding of the role and influence of newspapers and magazines.
Newspapers
In terms of audience reach, the following newspapers are the most popular:
| Ranking position | Newspaper | Release frequency | Audience coverage AIR thousand people |
|---|---|---|---|
| 1 | Argumenty i Fakty | Weekly | 6,987.8 |
| 2 | Komsomolskaya Pravda | Daily | 3,490.7 |
| 3 | Moskovsky Komsomolets – MK plus TV | Weekly | 1,237.9 |
| 4 | Rossiyskaya Gazeta | Daily | 938.8 |
| 5 | Narodny Sovet | Weekly | 875.9 |
| 6 | Izvestia | Daily | 873.5 |
| 7 | Sport-Express | Daily | 566.6 |
| 8 | Moskovsky Komsomolets | Daily | 500.5 |
| 9 | Kommersant | Daily | 408.4 |
| 10 | Vedomosti | Daily | 277.2 |
However, the ranking of newspaper citations, which is responsible for audience engagement, will be different.
| Ranking position | Newspaper | Citation Index (CI) |
|---|---|---|
| 1 | Izvestia | 2,081.79 |
| 2 | Kommersant | 1,881.37 |
| 3 | Vedomosti | 863.87 |
| 4 | Rossiyskaya Gazeta | 820.80 |
| 5 | Komsomolskaya Pravda | 472.30 |
| 6 | Argumenty i Fakty | 327.31 |
| 7 | Moskovsky Komsomolets | 326.23 |
| 8 | Parlamentskaya Gazeta | 312.63 |
| 9 | Argumenty Nedeli | 21.04 |
| 10 | Express-Gazeta | 15.48 |
Magazines
The ratings for Russian magazines demonstrate that readers continue to seek engaging content on a range of subjects. Travel, cooking, and gardening are among them.
The following magazines have the most comprehensive coverage:
| Ranking position | Magazine | Release frequency | Audience coverage |
|---|---|---|---|
| 1 | Vokrug Sveta (Russia) | Monthly | 6,261.8 |
| 2 | Antenna-Telesem | Weekly | 6,207.0 |
| 3 | Tyoschpin Yazyk | Weekly | 5,191.8 |
| 4 | Teleprogramma | Weekly | 4,758.4 |
| 5 | Your Family Doctor | Bimonthly | 4,496.4 |
| 6 | RBC Magazine | Bimonthly | 3,945.8 |
| 7 | Dacha Season (Russia) | Monthly | 3,684.0 |
| 8 | 7 Dney (7 Days) | Weekly | 3,134.0 |
| 9 | Caravan of Stories | Monthly | 2,941.7 |
| 10 | Secret of the Stars | Weekly | 2,114.4 |
What is the current status of glossy, scientific, and business publications in Russia?
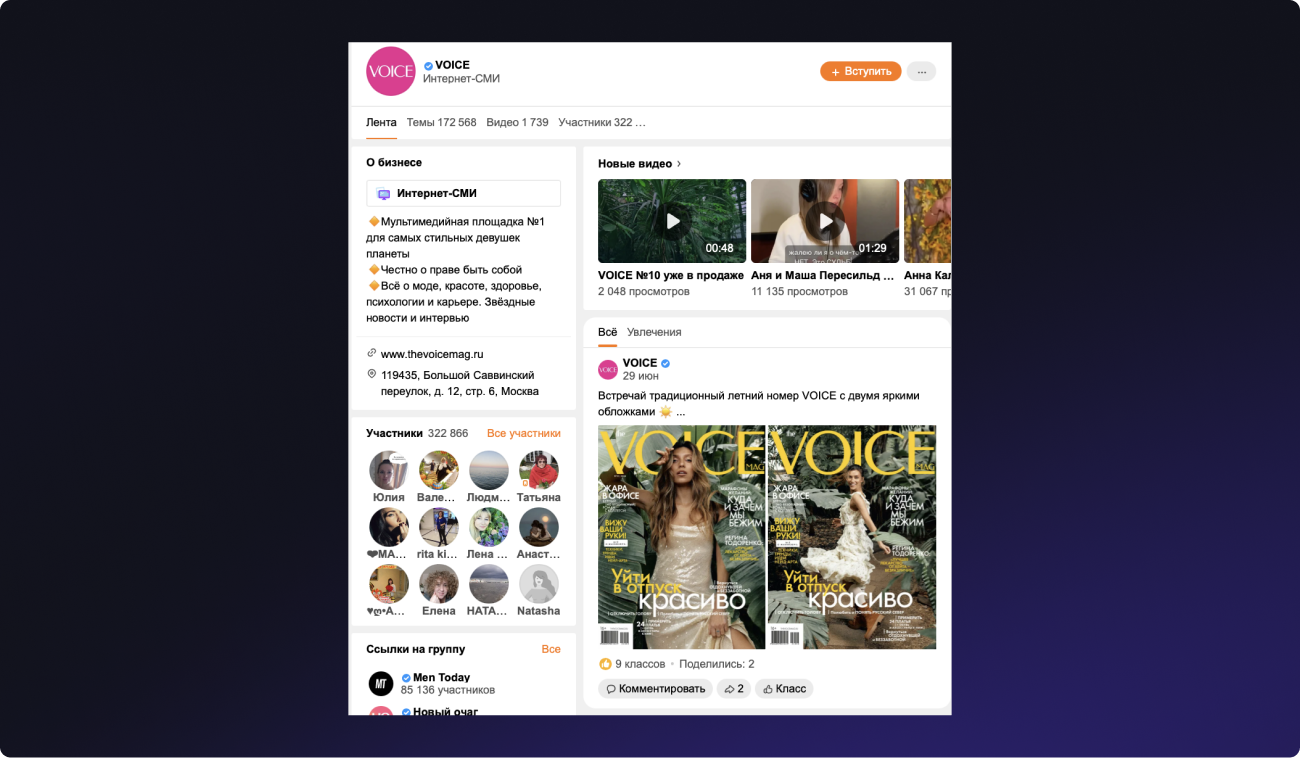
Following the commencement of the special operation in Ukraine, a number of major international glossy magazine brands ceased operations in Russia. The Condé Nast Publishing House has ceased publication of the following magazines: Vogue, GQ, GQ Style, Tatler, AD, Glamour, and Glamour Style Book. Independent Media has rebranded several of its titles, including Cosmopolitan (renamed Voice), Domashniy Ochag (now called Noviy Ochag), Men's Health (rebranded as Men Today), Harper's Bazaar (rebranded as The Symbol), and Popularnaya Mekhanika (now called TechInsider). Additionally, Esquire has been replaced by Pravila Zhizni. The Grazia and Robb Report magazines retained their original format.
Shkulev Media Holding has suspended the print editions of Elle, Elle Decoration, and Elle Girl and has ceased operations of their respective websites.
In 2022, the owners of the American Forbes magazine banned the Russian edition from selling advertising in the print version.
The most cited journals in Russia are:
| Ranking position | Magazine | Release frequency | Citation Index |
|---|---|---|---|
| 1 | Forbes Russia | Monthly | 375.94 |
| 2 | The Voice | 6 times a year | 53.99 |
| 3 | Profile | Weekly | 34.45 |
| 4 | Men Today | 6 times a year | 31.80 |
| 5 | Hello! | Monthly | 19.35 |
| 6 | Karavan Istoriy | Monthly | 13.80 |
| 7 | 7 Days | Weekly | 13.25 |
| 8 | Psychologies | 6 times a year | 12.01 |
| 9 | Snob | 4 times a year | 9.30 |
| 10 | Expert | Weekly | 6.32 |
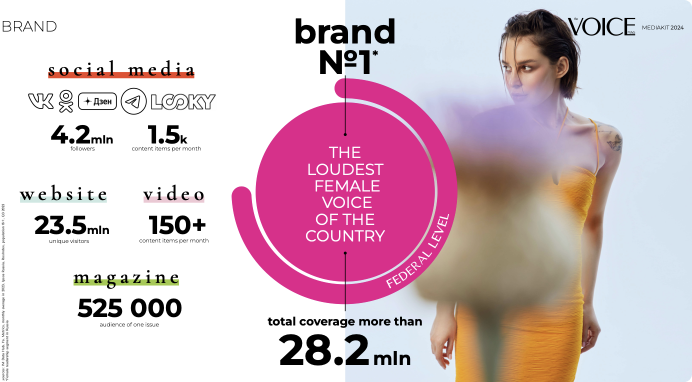
The Voice is the industry leader in terms of reaching the entire audience, including online readers, with a print version of the magazine reaching 653,000 people. Furthermore, the online edition boasts over 22 million unique visitors and 4 million followers across social media platforms.
The Russian magazine 7 Dney is in second place. It has an audience of 2.8 million people and a distribution of 650,000 copies. The total number of subscribers on social media platforms is 1 025 000 with an average of 13 441 000 monthly visits to the official website. Forbes Russia is the next most-followed publication in the sector. The print version of the magazine has a circulation of 100,000 copies, with 1.1 million readers per issue. Additionally, 9 million readers access the magazine online, including subscribers from social media accounts.
Media websites
Russian online media outlets are experiencing continued growth and expansion, offering immediate access to a diverse range of news and analytical materials. This aligns with global trends in digital transformation.
Most cited sites:
| Ranking position | Website | Citation Index |
|---|---|---|
| 1 | Rbc.ru | 2,256.93 |
| 2 | Gazeta.ru | 1,800.04 |
| 3 | Russian.rt.com | 1,867.68 |
| 4 | News.ru | 1,011.24 |
| 5 | Lenta.ru | 1,026.28 |
| 6 | Kp.ru | 735.16 |
| 7 | Life.ru | 807.11 |
| 8 | Baza.io | 608.77 |
| 9 | Aif.ru | 711.76 |
| 10 | 360.ru | 813.38 |
Media in social networks
In response to stricter regulation, increased blocking, and the digitalization of the news industry, many Russian news outlets have shifted their operations to Telegram. Several have initiated their activities on this platform without delay. Here are the five most popular news channels in terms of quotability and advertising integration:
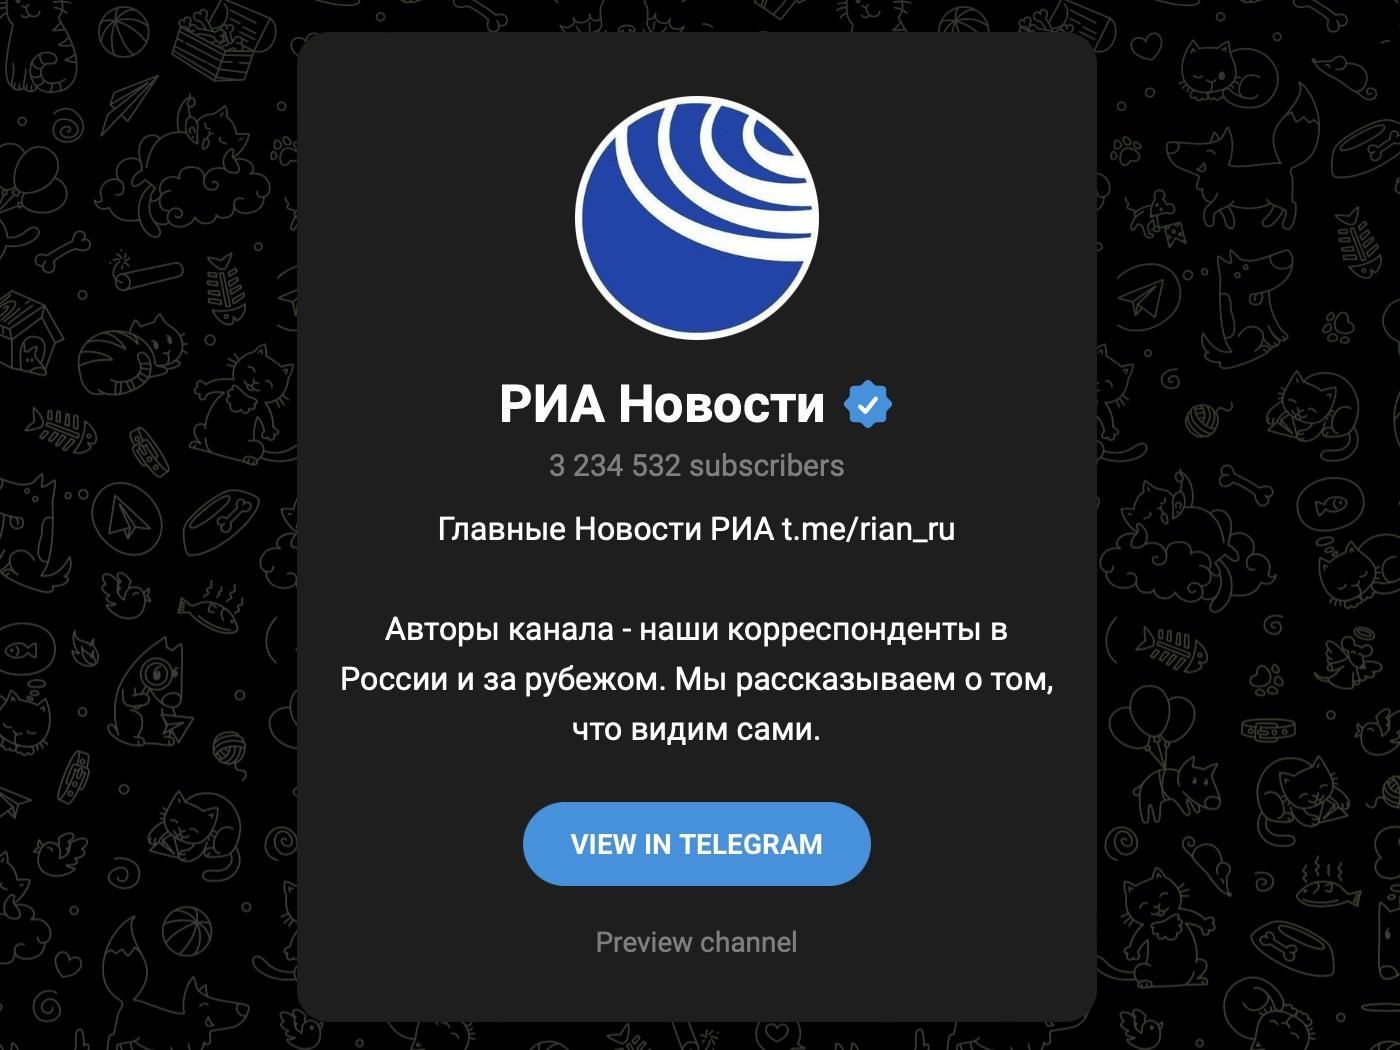
RIA Novosti
This is the official channel of the RIA agency, publishing news and analytics. It has 3.4 million subscribers and a citation index of 15,308. There is no third-party advertising on the channel.
RT na Russkom
This is the channel of the Russian international television network RT (formerly known as Russia Today). The channel has a subscriber base of 1 000 000 and a citation index of 16,849.
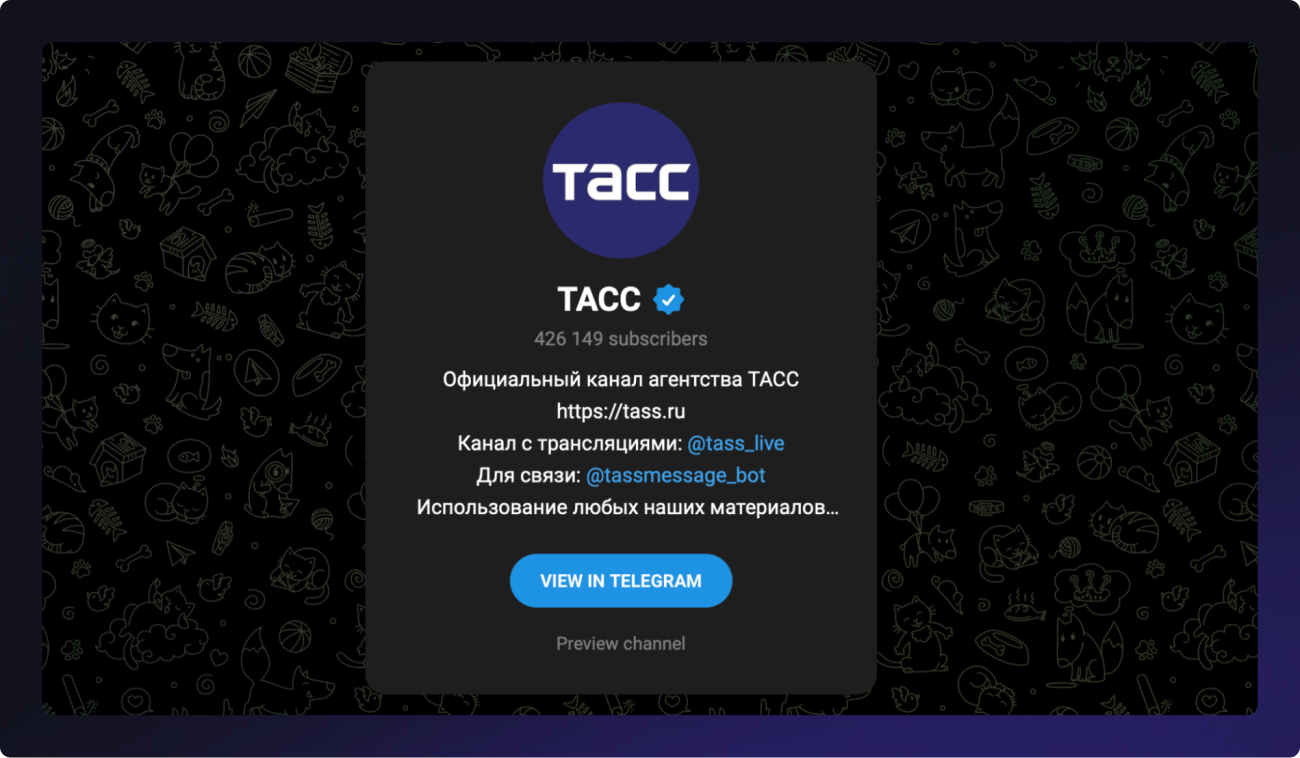
Tass
This is the official channel of the TASS news agency. The channel has 523 thousand subscribers and a citation index of 12,273. It does not feature advertisements from any third-party sources.
Baza
An independent online news channel with a specialization in investigative journalism and exclusives. It has 1.6 million subscribers and a citation index of 10,747.
They advertise mainly Russian banks, movie theaters, and quote other media publishers.
In terms of glossy, scientific, and business magazines, some have already established a robust online presence. Let us examine the social media accounts of the most prominent magazines in terms of their citation level and integration of advertising within their communities.
Popular magazines on social media
Forbes Russia
The media outlet's Telegram channel (241k subscribers, citation index — 2005) features not only business content but also well-thought-out native integrations. One example is a sponsored post with developer Sense, where the premium residential complex PHANTOM is presented as an architectural ‘sanctuary from the city noise‘.
Forbes is steadily gaining ground on VKontakte. The media company now has nearly a million subscribers. This is no longer just a news feed, but a full-fledged media platform for brand cases. One vivid example is a partner project with developer Upside Development. Through the theme of dream offices for generations Y and Z, the premium business center Upside Kuntsevo is subtly promoted here. Everything is crafted as a native story in the Forbes style, with a business tone, but a clear advertising message. This format is about context and trust, not just a banner ad.
Voice
A modern women’s magazine focused on personal stories, cultural topics, and themes of self-perception. Its Telegram channel has 46k subscribers and a citation index of 527. The media outlet is actively growing and building a recognizable voice: calm, thoughtful, with a focus on emotions, lifestyle, and strength without pretension. Voice is also present on VKontakte, Odnoklassniki, and Dzen. No commercial placements have been identified on Telegram yet. The channel is built around trust and gentle engagement.
Hello!
A glossy magazine about celebrities with a focus on personal stories and lifestyle. The media outlet’s Telegram channel has 20k subscribers, with a primary emphasis on visual content and interview quotes. Hello! is more actively growing on other platforms: 136k subscribers on VKontakte and 65k on Dzen. The publications are aimed at a female audience aged 30+, with content that is soft and magazine-style. No commercial integrations have been identified on Telegram so far.
Profil
A political and business magazine that maintains activity on social media, though without significant audience growth. Telegram, VKontakte, and Odnoklassniki each have about 10k subscribers. Despite modest reach, the media outlet continues to comment on relevant market topics. For example, a post on the VKontakte offers an overview of the current situation of car brands in Russia, without any entertainment context, but in an analytical tone. This is an example of how niche media can maintain expertise and focus, even with limited reach.
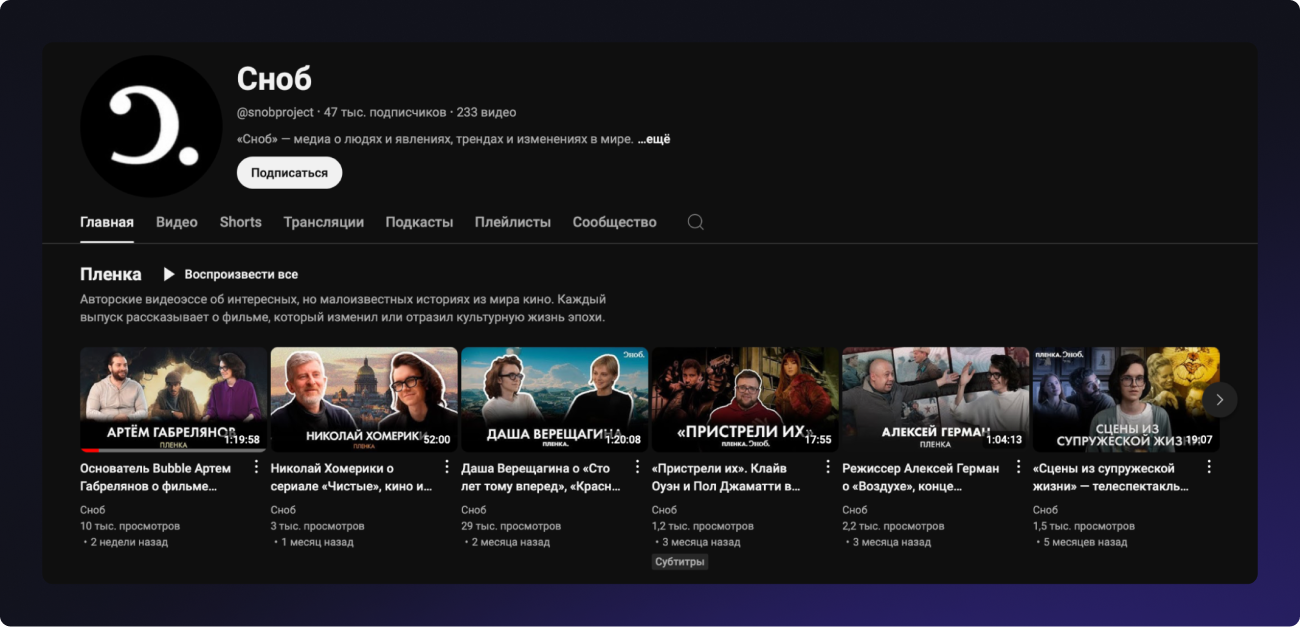
Snob
The media outlet continues to operate in the niche of cultural and intellectual journalism. Commercial integrations are done in the same style: through context, associations, and the value of content. An example is a partner post in the Snob official VK community with 'Yandex Books’, timed to the release of Guzel Yakhina’s book Eisen. The post focuses on the figure of Sergey Eisenstein and his connection to Meyerhold's theater. The sale is not forced, but embedded within the cultural narrative.
The Telegram channel has 32k subscribers, and the outlet maintains a respectable citation index (431), which reflects its influence in the professional community. It also has communities in Odnoklassniki and Dzen. Advertising integrations are presented in an editorial style: for example, a post about Sergey Eisenstein served as a native introduction to the release of Guzel Yakhina’s book on 'Yandex Books’. This is an example of ‘smart advertising’, without a direct offer, but through context that is interesting to the audience in itself.
Almost all of the magazines we featured have their own YouTube channels—for example, Snob. This provides additional opportunities for brand advertising.
Conclusion
In 2025, Russian media outlets will continue to transition to digital formats in line with the global trend towards digitalization in the media industry. This process has an impact on the entire media business, including the advertising market and media regulation. The primary drivers of this transformation are advances in technology, increased competition, evolving consumer preferences, and the emergence of mobile services.
The downward trend in print newspaper circulation and popularity continues, with digital formats gaining ground. Analysts project that the market for printed newspapers and magazines in Russia will continue to diminish between 2024 and 2029. Consequently, numerous publications are sustaining their market presence through the retention of a devoted audience and the adaptation to evolving market conditions. For instance, numerous magazines are implementing subscription models, providing exclusive content and supplementary services to paid subscribers.
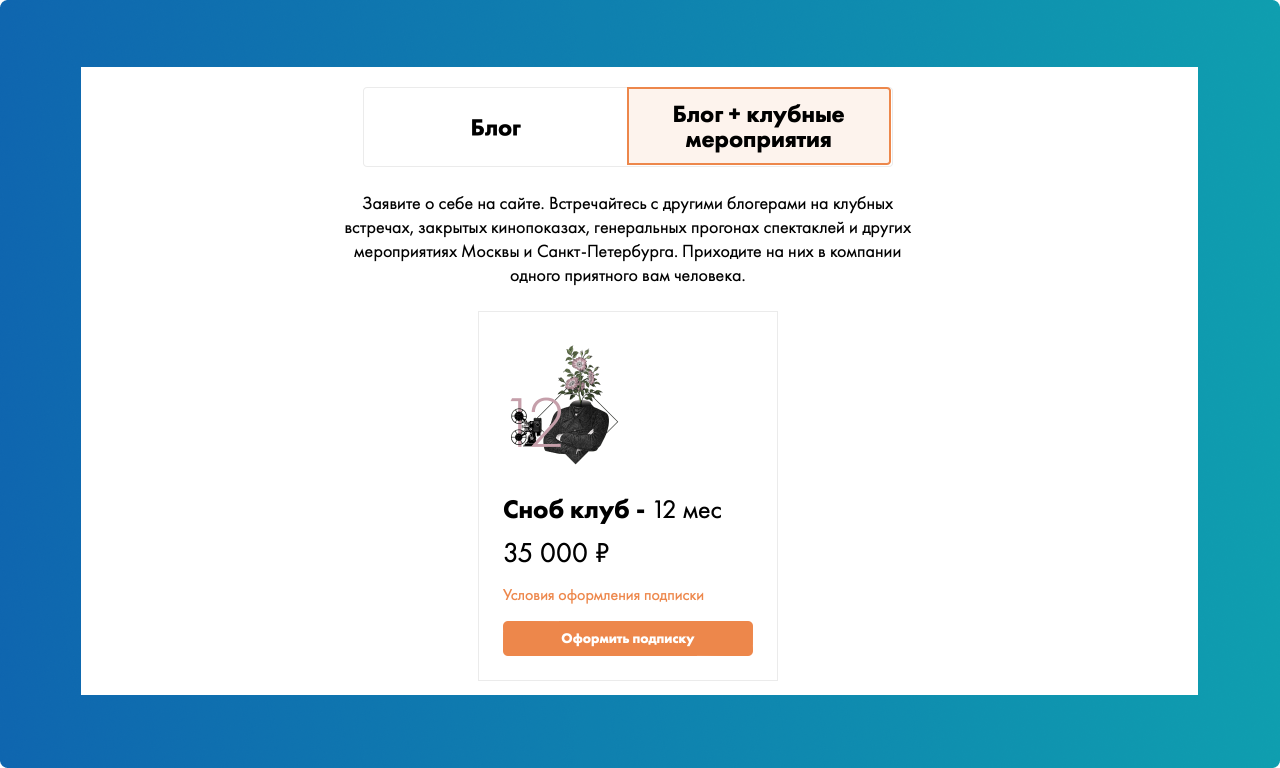
Snob magazine's offer to join the club and become an active member with the opportunity not only to read exclusive articles by others but also to publish its own content.
In light of the exponential growth of the Internet audience and the active consumption of digital content, it is evident that a professional approach is essential for effective promotion in the media.
As of January of this year, the number of internet users in Russia reached 133 million. This trend is driving the development of digital media, and brands are finding it profitable to invest in advertising, which is stimulating further digitalization of media. However, to fully leverage the potential of the digital landscape, a strategic approach from industry experts is essential.
RMAA is prepared to assist with the promotion of your brand in the Russian media market, offering a range of strategies and formats to suit your needs. To contact our manager, please complete the form below. Subscribe to our blog to be among the first to receive the latest information on digital marketing in Russia.
Follow us in social media


Join 2,000+
of your Peers!
You will be the first to know about Russian marketing insights, news and updates from our agency. Stay tuned!
Get our latest articles delivered to your email inbox and get our exclusive White Paper
"A media buyer's quick guide for effective work in Russia"
for FREE!
How does the Media Buying Market in Russia Work?
Navigating the Media Buying System in Russia

Ready to partner with the specialists in Russian marketing and advertising?
About the Author
Resident Author at RMAA Blog. Polina shares insights and expertise on the latest trends in the Russian-speaking marketing landscape.
 Polina Nesterova
Join 2,000+ of your Peers!
Get our latest articles delivered to your email inbox and get our exclusive White Paper "A media buyer's quick guide for effective work in Russia?" for FREE!
You will be the first to know about Russian marketing insights,
news and updates from our agency.
Stay tuned!


We're updating our website's design step by step, so some pages may look different. Thank you for your understanding.
Got it